
How to Measure Automation ROI for GM OAMI
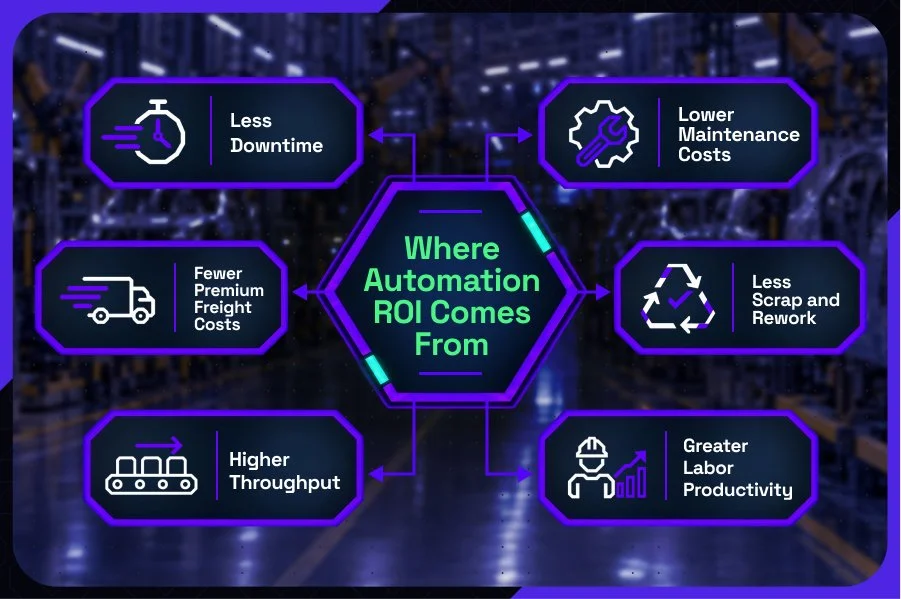
For automotive suppliers evaluating GM's Overall Automation Maturity Index (OAMI), a common question is financial: what will it cost to raise automation maturity, and what will the investment return?
There is no standard price for improving an OAMI score. GM has not published a technology checklist or a cost model tied to individual OAMI levels. The automaker has also described OAMI metrics as goals rather than requirements, although reporting indicates GM is targeting a supplier maturity level of 4.5 out of 5.
That means suppliers need to build the business case around their own operations.
The relevant costs of automation maturity can include:
Machine connectivity
Controls
Supervisory Control and Data Acquisition (SCADA)
Manufacturing execution systems (MES)
Integration
Analytics
Cybersecurity
Implementation
Training
The return on automation investments can come from:
Reduced downtime
Lower scrap and rework
Improved throughput
More productive labor
Lower maintenance costs
Fewer production disruptions
For suppliers with significant GM business, there is another consideration: the strategic value of remaining competitive for future sourcing.
What Does It Cost to Upgrade a Tier 1 Supplier to Industry 4.0?
The cost of upgrading a Tier 1 automotive plant to support Industry 4.0 varies significantly depending on the plant’s existing equipment, software, connectivity and integration requirements. There is no standard Industry 4.0 upgrade cost or published cost tied to a specific OAMI score.
For some suppliers, the investment may focus on connecting existing equipment and improving data visibility. For others, it may involve broader upgrades to manufacturing software, controls, analytics, cybersecurity and plant infrastructure.
For example, published vendor estimates for MES implementations range from the low six figures for smaller or cloud-based deployments to seven figures for more complex plants. Those estimates should be treated as planning references rather than as standard Industry 4.0 costs, because implementation requirements differ substantially among manufacturers.
The cost of raising automation maturity depends on the existing plant infrastructure, the number and age of production assets, current software systems, integration requirements, and the extent to which new capabilities are deployed.
There is no reliable industry benchmark for the cost of moving from one OAMI level to another. GM has not published one, and available MES pricing benchmarks vary widely depending on deployment scope.
A supplier developing its own budget should separate the investment into several areas:
Machine and IIoT connectivity: Sensors, gateways, PLC connectivity, industrial networks and edge devices needed to collect production data.
SCADA and HMI systems: Supervisory monitoring and control of equipment, processes and production conditions.
Data infrastructure: Historians, databases or unified data layers that make machine information accessible across systems.
MES: Production management capabilities connecting equipment data with orders, quality, traceability, scheduling and plant performance.
ERP and enterprise integration: Connections between manufacturing operations and systems responsible for inventory, purchasing, finance and planning.
Analytics and digital twins: Tools that use operational data for optimization, simulation, predictive maintenance and decision support.
OT cybersecurity: Network segmentation, access controls, asset visibility and security measures appropriate for increasingly connected production environments.
Implementation and workforce enablement: Integration, configuration, validation, training and process changes required to use the technology effectively.
The right number is therefore less important than understanding which capability gap the investment closes and which measurable loss it addresses.
Why Can Connectivity Come Before Equipment Replacement?
For many established automotive plants, improving automation maturity does not necessarily begin with replacing every legacy production asset.
Existing machines may already contain PLCs, sensors or controls capable of producing useful operating data. Industrial gateways, edge devices and integration software can sometimes make that information available to higher-level systems without changing the underlying production equipment.
This creates a practical starting point for Industry 4.0 initiatives: establish the data foundation first.
Connectivity can make previously isolated assets visible across production systems. Once data is consistently available, manufacturers can begin measuring causes of downtime, cycle-time variation, machine states, quality conditions, production performance, and other operational KPIs in real time.
This visibility also helps identify where larger capital investments are justified. A plant can distinguish between a machine that genuinely needs replacement and a machine whose biggest limitation is poor data availability or integration.
The business case for automation maturity should be evaluated on an asset-by-asset basis. However, a connectivity-first strategy can allow manufacturers to build the data infrastructure required for more advanced automation before committing to broader equipment replacement.
Which KPIs Show the Return on Automation Maturity?
Automation maturity should ultimately be connected to measurable operational performance.
Because GM has not published a detailed list of KPIs assigned to individual OAMI levels, manufacturers should build an OAMI-aligned scorecard focused on the losses that automation investments are intended to reduce.
Useful KPIs can include:
| KPI | What It Measures |
|---|---|
Overall Equipment Effectiveness (OEE) |
Availability, performance and quality together. |
Downtime |
How much scheduled production time is lost and why. |
Mean Time Between Failures (MTBF) |
Equipment reliability and the frequency of failures. |
Mean Time to Repair (MTTR) |
How quickly failed equipment can be restored. |
First-Pass Yield |
How much production meets requirements without rework. |
Scrap and Rework |
Quality losses caused by defective or nonconforming production. |
Parts Per Million (PPM) |
Defect rates at the production or customer level. |
Cycle Time Variance |
Instability or inconsistency in production performance. |
Schedule Attainment |
Whether actual production follows the planned schedule. |
Throughput |
Production output over a defined period. |
Labor Productivity |
Output relative to labor inputs. |
Premium Freight and Expedite Costs |
Costs created when production or supply disruptions require accelerated logistics. |
The purpose of these KPIs is to show that a plant is becoming more automated and to help demonstrate whether automation investments are producing measurable financial and operational improvements.
The resulting data also creates a baseline against which the ROI of future automation investments can be measured.
How Can Digital Twins Reduce Automotive Manufacturing Downtime?
Digital twins use operating data to create a virtual representation of an asset, production line or factory that can be used to understand and optimize real-world operations.
In manufacturing, a digital twin can combine information from production equipment, operational systems, inventory data and production schedules. Teams can then model production scenarios before making changes on the physical plant floor.
Potential applications for digital twins in manufacturing include:
Identifying bottlenecks before they cause larger production losses
Testing production sequencing changes
Evaluating line balancing decisions
Predicting the effect of equipment or scheduling changes
Supporting predictive maintenance
Modeling the effect of new products or increased production volume
Digital twins can help manufacturers identify potential production issues earlier, test changes before implementing them and use connected operating data to support more proactive maintenance and planning decisions.
Their value depends on the quality of the available data, the problem being modeled and whether teams can act on the resulting insights.
For budget holders, the more useful question is whether a digital twin addresses a measurable source of loss that is large enough to justify the investment.
How to Measure and Calculate Automation ROI for GM OAMI
Calculating ROI for an OAMI-related automation investment starts by comparing the project's full cost to the operational and strategic value it is expected to deliver.
GM has described OAMI metrics as goals rather than formal requirements, so suppliers should treat the calculation as an OAMI-related business case rather than assuming a standard compliance cost or a required payback threshold.
To measure automation ROI using the OAMI framework, suppliers can compare changes in operational performance and financial outcomes against the investments made to improve automation maturity. OAMI provides the maturity context, while plant-level KPIs such as downtime, OEE, scrap, throughput, maintenance cost and labor productivity provide the measurable evidence of return.
The specific calculation will vary by plant, project scope and operational priorities. Instead of relying on a single formula, suppliers should quantify the areas where the proposed investment is expected to create value.
Establish the Full Investment Cost
Start by identifying the total cost of the automation initiative, including both upfront and ongoing expenses.
Depending on the project, this may include:
Machine connectivity, sensors, gateways or edge devices
MES, SCADA or other manufacturing software
System integration and data infrastructure
Analytics, predictive maintenance or digital twin capabilities
OT cybersecurity
Implementation and configuration
Training and change management
Ongoing software, support and maintenance costs
Including the full lifecycle cost makes it easier to compare the investment with the benefits it is expected to produce.
Calculate the Value of Reduced Downtime
Estimate how much unplanned downtime currently costs the plant and how much of that loss the proposed investment could realistically reduce.
Relevant inputs may include:
Annual downtime hours
Lost contribution margin during downtime
Labor costs during stopped production
Maintenance and repair costs
Overtime required to recover production
Customer penalties or other disruption-related costs
Where possible, improvement assumptions should come from the plant's own pilot results, maintenance history or operational data rather than broad industry averages.
Measure Scrap and Rework Savings
Automation can also create value by improving process visibility and identifying quality issues earlier.
Suppliers should quantify:
Current scrap costs
Rework labor and material costs
Cost of containment or inspection
Customer quality claims or chargebacks
Production time lost to quality issues
The expected savings should reflect the specific quality problems the investment is designed to address.
Estimate Throughput and Capacity Gains
Some automation investments create value by increasing output from existing equipment rather than reducing direct costs.
Relevant measures can include:
Additional sellable units
Improved cycle times
Better schedule attainment
Higher equipment utilization
Reduced changeover time
Capacity created without adding new equipment
The financial value should be based on the contribution margin associated with additional production, not simply on gross revenue.
Quantify Labor Productivity Improvements
Labor savings should focus on productive capacity rather than assuming automation will eliminate jobs.
Potential gains may come from reducing time spent:
Collecting production data manually
Reconciling information between systems
Investigating downtime causes
Entering duplicate data
Building manual production reports
Responding to avoidable disruptions
The value can then be based on the labor hours recovered and how that capacity can be redirected toward higher-value production, maintenance, quality or planning work.
Include Maintenance Savings
For projects involving condition monitoring, predictive maintenance or better equipment visibility, suppliers can also measure changes in:
Emergency maintenance
Preventive maintenance hours
Spare-parts consumption
Contractor costs
Repeat equipment failures
Secondary damage caused by unexpected breakdowns
These savings may be especially relevant where downtime and maintenance are already major drivers of plant costs.
Review Premium Freight and Expedite Costs
Production disruptions can also create costs outside the plant.
Review historical spending on:
Premium freight
Expedited shipping
Emergency material movements
Recovery shipments
Other logistics costs caused by production or scheduling problems
If the automation investment is expected to improve schedule reliability, these costs can form another measurable part of the ROI case.
Compare the Benefits With the Investment
Once the relevant benefits have been quantified, compare the expected annual value with the project's upfront and recurring costs.
A strong business case should show:
Total project cost
Expected annual savings or value creation
Expected payback period
Expected performance improvement by KPI
Conservative, expected and higher-return scenarios
The assumptions behind each estimate
This makes the financial case easier to evaluate and gives decision-makers a way to test how sensitive the return is to different operating assumptions.
For OAMI-related projects, the goal is not to assign a dollar value to a higher maturity score itself. Instead, suppliers can measure whether investments in increasing automation maturity yield measurable improvements in plant performance and whether those gains justify the cost.
Build the Business Case for Automation Maturity With Fuuz
Raising automation maturity is easier to justify when each investment can be tied to measurable improvements in downtime, quality, throughput, maintenance, labor productivity, or other plant KPIs.
Fuuz is a unified industrial operations platform that connects machines, systems, people, and data within a single operational layer. For automotive suppliers, that means production equipment, PLCs, ERP systems, databases, and other applications can work together without creating another disconnected technology silo.
Fuuz combines connectivity with capabilities across manufacturing execution, maintenance, quality, warehousing, workflows, analytics, and real-time reporting. This gives manufacturers a way to collect operational data, act on it, and measure whether automation investments are producing the expected return.
For OAMI-related modernization, Fuuz can support a phased approach: connect existing assets, improve visibility, automate higher-value workflows, and expand capabilities as operational results and ROI support further investment.
Contact Fuuz to discuss how we can support a connected manufacturing and automation maturity roadmap for your manufacturing operations.